Description of Test:
Qik CPT is a computerized visual continuous performance test developed
for assessing attention and impulse control. The EEG Expert Report on
Qik CPT is specifically intended for use by neurofeedback clinicians
for assessment and monitoring the effects of EEG training.
A simple visual target or non-target is presented once
every two seconds. During the 21-minute test, the subject must press a
button to respond to each target and not press for each non-target.
Primary Variables of Attention:
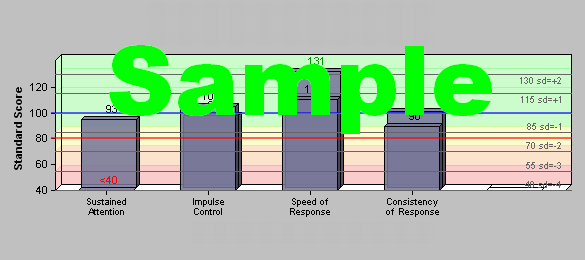
Sustained Attention reflects Omission Errors, which occur when the subject does not respond to the target.
Impulse Control reflects Commission Errors, which occur when the subject incorrectly responds to the non-target.
Speed of Response reflects Response Time, the processing time that it takes to respond correctly to a target.
Consistency of Response reflects Variability of Response Time, the standard deviation of correct response times.
RESULTS
Data
Norm ± St. Dev
#SDs
Standard Score
Sustained Attention
0.0 %
0.1 ± 0.1 %
-0.5
107
Impulse Control
1.9 %
1.9 ± 2.0 %
0.0
100
Speed of Response
321.1 ms
398.3 ± 66.9 ms
-1.2
117
Consistency of Response
71.5 ms
77.9 ± 21.1 ms
-0.3
105
These results, compared to same age and gender norms, are reported as
standard deviations and standard scores. The standard deviation
indicates the extent of a problem (or deviation from the norm). The
normal range is between -1 and +1 standard deviations. The standard
score also compares these results to the norm. One standard deviation
equals 15 standard score points. The normal range of standard scores is
85 to 115. Scores below 80 are considered significantly below average,
and scores above 120 are considered significantly better than average.
· Results table data are calculated on total test results.
· Standard scores significantly below average(<80) are printed in red.
· Standard scores significantly above average (>120) are printed in green.
· Qik CPT results are confidential.
EEG EXPERT REPORT ON QIK CPT Visual Test
Page 2
Initials: AB
Date:
Test #: 1
RAW DATA
Period 1 Sect. 1 Low Demand
Period 2 Sect. 1 Low Demand
Period 3 Sect. 2 High Demand
Period 4 Sect. 2 High Demand
Period 5 Sect. 3 Low Demand
Sect. 1
Sect. 2
Sect. 3
Total
Omissions (#)
0
0
0
0
0
0
0
0
0
Commissions (#)
2
0
5
5
0
2
10
0
12
Response time (ms)
359
366
296
307
377
362
301
377
321
Variability (ms)
73
63
55
67
76
69
62
76
71
STANDARD SCORES
Period 1
Period 2
Period 3
Period 4
Period 5
Section 1
Section 2
Section 3
Total
Omission Errors
100
104
107
100
104
103
106
104
107
Commission Errors
94
106
106
105
106
100
106
106
100
Response Time
114
115
122
117
113
115
119
113
117
Variablity
96
97
115
103
88
97
110
88
105
OTHER RESPONSES
Period 1
Period 2
Period 3
Period 4
Period 5
Section 1
Section 2
Section 3
Total
Anticipatory Resp. (#)
0
0
0
0
0
0
0
0
0
Multiple Responses (#)
0
0
0
0
0
0
0
0
0
Post-commission RT (ms)
321
0
279
277
0
321
278
0
285
Periods 1 and 2 (in section 1) and period 5 (in section 3) represent the target-infrequent or boring task.
Periods 3 and 4 (in section 2) represent the target-frequent or high response demand task.
Anticipatory Responses occur within 150 milliseconds of any stimulus (target or non-target).
Multiple Responses reflect more than one response to a stimulus
Post-commission Response Time is the response time immediately following a commission error.
Scores significantly below average are printed in red.
Scores significantly above average are printed in green.
EEG EXPERT REPORT ON QIK CPT Visual Test
Page 3
Initials: AB
Date:
Test #: 1
EEG EXPERT REPORT ON QIK CPT Visual Test
Page 4
Initials: AB
Date:
Test #: 1
X-Axis for all charts: time into QIKtest in msec, with vertical gridlines of 1 minute
EEG EXPERT REPORT ON QIK CPT Visual Test
Page 5
Initials: AB
Date:
Test #: 1
EEG EXPERT REPORT ON QIK CPT Visual Test
Page 6
Initials: AB
Date:
Test #: 1
I N T E R P R E T A T I O N
I. TOTAL SCORES:
→ All total scores are within the normal range.
II. SCORES BY SECTION
→ All scores by section are within the normal range.
→ Variablity of Response Time standard scores are significantly worse in the first section than the second section.
The first section is the boring task (target-infrequent condition).
Lower scores in the first section may indicate under-arousal and
greater difficulty attending during a boring task.
III. SCORES BY PERIOD
→ Standard scores for Variablity of Response Time are significantly worse in period 4 than period 3. This indicates an inability to maintain attention under high response demand conditions.
→ Standard scores for Commission Errors are significantly worse in period 1 than period 2. This could be indicative of excessive anxiety.
→ Post Commission Response Time is faster than average correct Response Time in periods 1, 3 and 4. A
Post Commission Response Time is the response time immediately
following a Commission Error. People typically slow down after a
Commission Error. Speeding up after a Commission Error indicates
increased speed with increased attention after an error. This might
indicate that Commission Errors are resulting from inattention rather
than over arousal, and might reflect lack of frontal control and
possibly under arousal. Look at graph of response times to see which
Commission Errors are faster (impulsive) or slower (inattentive) than
average.
EEG EXPERT REPORT ON QIK CPT Visual Test
Page 7
Initials: AB
Date:
Test #: 1
Coming soon: Pre-Post Score Graphs
Sample pre-post graph of two sets of scores
(data is anonymized and is based on non-patient test data)
This page was generated by the EEG-server in 8.441 seconds on 1/10/2006 10:50:40 AM .